
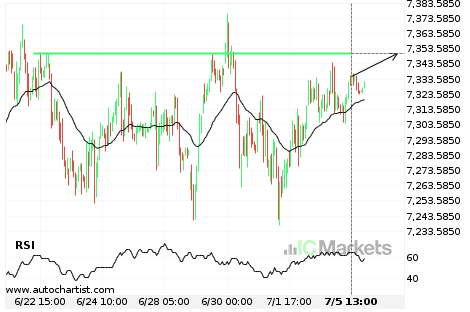
Australia 200 Index approaching important 7350.3901 price line
Australia 200 Index is approaching the resistance line of a Resistance. It has touched this line numerous times in the last 14 days. If it tests this line again, it should do so in the next 2 days.
FTSE China A50 Index – getting close to support of a Channel Down
FTSE China A50 Index is moving towards the support line of a Channel Down. Because we have seen it retrace from this line before, we could see either a break through this line, or a rebound back to current levels. It has touched this line numerous times in the last 4 days and may test […]

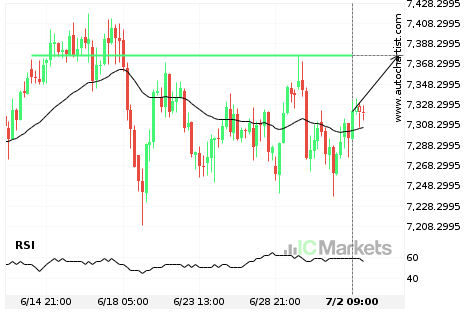
Australia 200 Index approaching important 7376.6299 price line
Australia 200 Index is approaching the resistance line of a Resistance. It has touched this line numerous times in the last 19 days. If it tests this line again, it should do so in the next 3 days.
Australia 200 Index approaching important 7376.6299 price line
Australia 200 Index is approaching the resistance line of a Resistance. It has touched this line numerous times in the last 19 days. If it tests this line again, it should do so in the next 3 days.

Hong Kong 50 Index experienced an exceptionally large movement
For those of you that don’t believe in trends, this may be an opportunity to take advantage of an exceptional 1.55% move on Hong Kong 50 Index. The movement has happened over the last 3 days. For those trend followers among you, you may think about riding this trend.
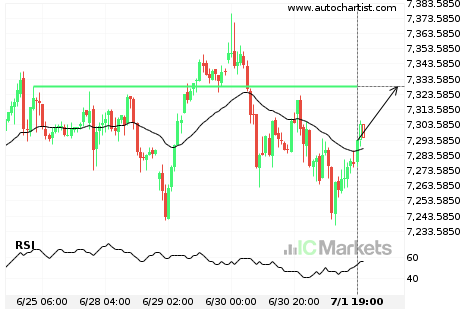
Australia 200 Index approaching important 7328.8101 price line
Australia 200 Index is approaching the resistance line of a Resistance. It has touched this line numerous times in the last 7 days. If it tests this line again, it should do so in the next 23 hours.
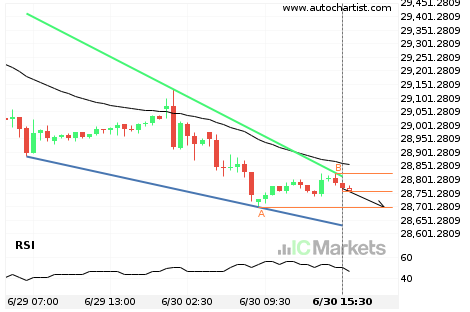
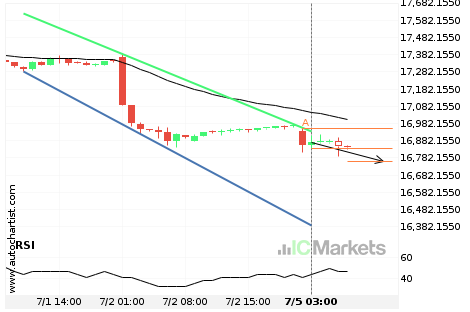
Hong Kong 50 Index – getting close to support of a Falling Wedge
Hong Kong 50 Index is moving towards the support line of a Falling Wedge. Because we have seen it retrace from this line before, we could see either a break through this line, or a rebound back to current levels. It has touched this line numerous times in the last 2 days and may test […]
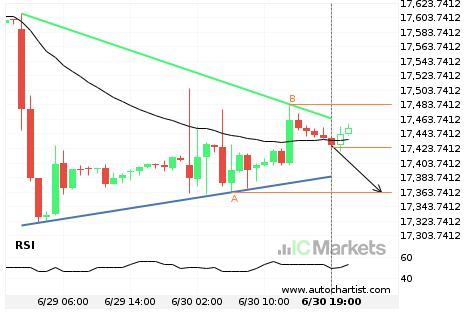
FTSE China A50 Index – getting close to support of a Triangle
FTSE China A50 Index is moving towards the support line of a Triangle. Because we have seen it retrace from this line before, we could see either a break through this line, or a rebound back to current levels. It has touched this line numerous times in the last 2 days and may test it […]
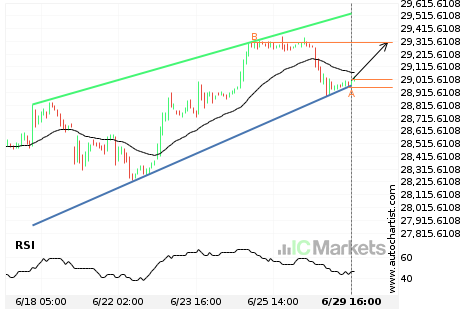
Either a rebound or a breakout imminent on Hong Kong 50 Index
Hong Kong 50 Index is heading towards the resistance line of a Rising Wedge. If this movement continues, we expect the price of Hong Kong 50 Index to test 29309.7000 within the next 2 days. But don’t be so quick to trade, it has tested this line numerous times in the past, so this movement […]